
....
What is the definition of the operational efficiency?
In Wikipedia we find that “In a business context, operational efficiency can be defined as the ratio between an output gained from the business and an input to run a business operation.” In the factory, the input is the time spent to produce the product, that is the time between the start- up and the end of the production. This is called the Loading Time(LT). The output is the product  produced during the loading time, which, however, has to be converted in time units, because the operational efficiency is expressed as a percentage. Here is how we convert the product in time units.
The product is produced in a production line consisting of a few automatic or semi-automatic machines and occasionally some manual operations. The speed of the production line is the speed of the filler as defined by its Manufacturer and is known as Name Plate Speed (NPS). Dividing the product produced by the NPS of the production line, gives the valued operating time (VOT). This is the time during which the production line is producing quality acceptable product. The VOT excludes any stoppages of the production line due to breakdowns, minor stoppages, low speed and defect product. In other words, the VOT is the time that the production line is producing value for the customer, that is value that the customer is willing to pay. The VOT is the equivalent of the product in time units and the OEE is the ratio of VOT over LT.
How exactly is the operational efficiency calculated?
Let’s assume that a production line produces in 8 hours of loading time (LT) 20 tons of product at an NPS of 4 tons/h (see fig.1). 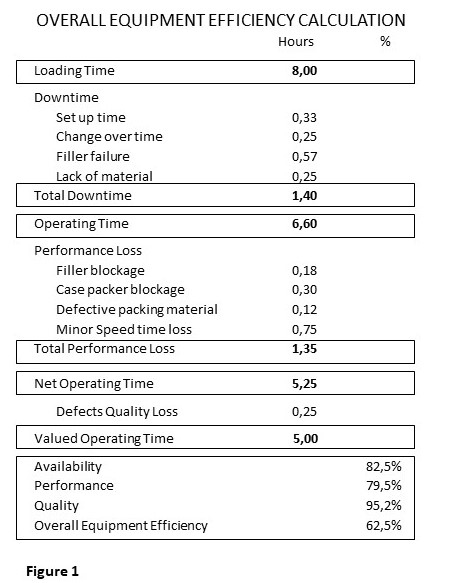 During these 8 hours there occurred 1,4 hours downtime consisting of stoppages like set up time (start up and shut down time), change over time, lack of material and a few filler machine breakdowns (see fig.1). That leaves 6,6 hours , the so-called Operating Time (OT) that are available for production.
During these 6,6 hours there occur also some minor stoppages, that together with some speed loss, amount to 1,35 h of performance losses. Subtracting the performance loss from the operating time gives a net operating time (NOT) of 5,25 h. (see fig.1)
Converting the rejected defect product to time, by dividing the defects weight by the NPS, gives 0,25 h. This results in 5 h of valued operating time (VOT), which is also the result of the 20tn of product divided 4 tn/h .
The OEE is calculated by dividing the NOT by the LT, in this example 5/8*100 = 62.5%.
The three KPIs at the bottom of fig.1 evaluate the performance of the factory in managing the downtime losses due to equipment failures or routine downtime, the performance losses due to minor stoppages or speed losses, and the quality losses. By multiplying all three we get the OEE%.
The OEE losses are illustrated in fig.2. Each factory can decide the sort of downtimes and performance losses they wish to 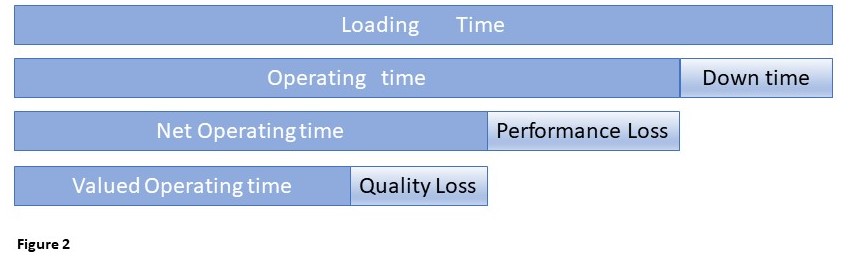 monitor on every production line. The reason for grouping the downtime losses separately from the performance losses is that they are tackled differently in improvement projects.
What is important to remember here is, that the VOT should always match the division of the production by the NPS of the production line. Any difference indicates missing downtime or performance loss.
How is monitoring of the operational efficiency implemented?
Having defined what is it and how is the OEE calculated, the following lines describe the Production Line Monitoring System (PLMS), a system that implements it in a factory. The PLMS consists of one terminal with a touch screen per production line, connected by Ethernet to a central PC, which is in turn connected to the LAN of the company. The terminal collects all the time losses of the filler and the production of good and defect product, via the carton and pallet label printers, and updates on-line / real-time the central PC. The central PC updates all the terminals with the pending production orders and maintenance orders, plus any other useful information about the product in production eg. OEE, product data (expiry date, primary and secondary packing weights, pallet load, NPS)
Three parameters, that are essential for the calculation of the OEE, are in the core of the PLMS:
- the quantity of the production,
- the loading time and
- the NPS of the production line.
The PLMS gets the counting of the production and any rejected defect product from the label printers. The loading time is automatically recorded from the moment the operator selects the production order from the touch screen up to the moment he switches off the production line.
All the downtime and performance losses are recorded on-line / real-time, accurately and reliably by the terminal that monitors the filler of the production line.
Any attempt to relay on manually jotting down the stoppage time by the operator, results in practically missing all the minor stoppages, let alone any inaccuracy in recording the downtime. Experience has proven that in this case ca. 40 – 60% of the stoppage time is lost and this results in the wrong estimation of the OEE (over estimation).
The recording of the stoppage reason of the filling machine is done by the operator, who manually selects it, by choosing among a pre-set selection of reasons on the touch screen.
The on-line / real-time counting of the production and the defects and the VOT enables the PLMS to continuously update the OEE. It calculates also the instant OEE (OEE – d) of the production line every 10 mins.
Why is the operational efficiency monitoring so important?
You can’t manage if you don’t measure, and you can’t manage effectively if you don’t measure accurately and reliably. The operator of the production line can every moment see on the touch screen what has been produced, what remains to be 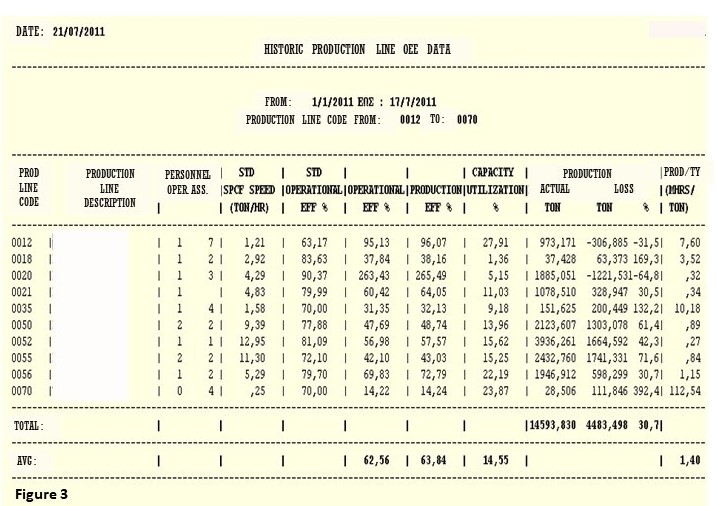 produced to fulfil the production order and whether his production line lags behind the OEE target. The PLMS has great processing capabilities to support the informed decision making of the Production, the Maintenance and the Production Planning functions.
The historical data (fig.3) from the previous day or any selected past period reveal the losses, the OEEs, and the productivity per each individual production line as well as for the whole production operation. This provides an excellent informed decisions tool to select future improvement actions.
The “Production Snapshot” report (see fig.4), gives the production supervisor, upon request, a robust estimate, whether a production line will manage to execute the production order in time, or the planner will have to modify the production schedule. See for example the last two rows in fig.4. The production line 50 runs at a low OEE similar to that of line 56 but will most probably execute the production 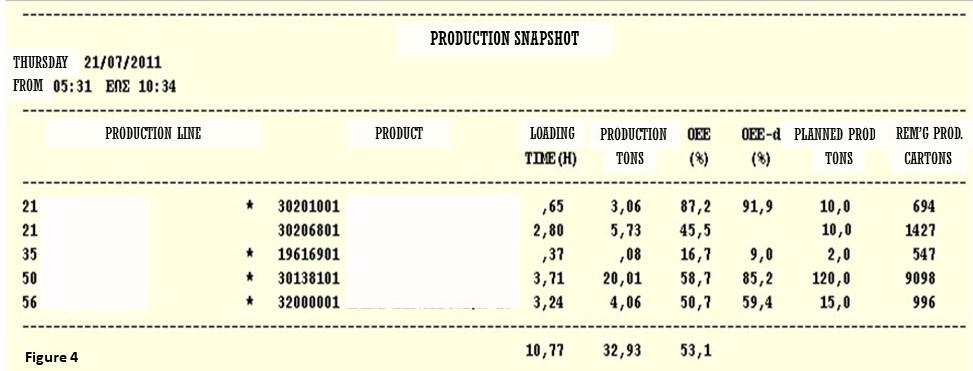 order in time, because it has recovered and now runs at an instant OEE-d of 85,2%.
The Production Manager gets upon request the production report of the previous day or any previous period, fit with the production volume and the analysis of the losses in terms of differences from the target loss per loss reason. This is expressed in lost production volume and is prioritized by volume loss (see fig. 5). To facilitate the fast identification of the most important losses, a threshold can be set as a percentage of loss eg. 5% - 20% (see at the top of fig. 5). This practically produces 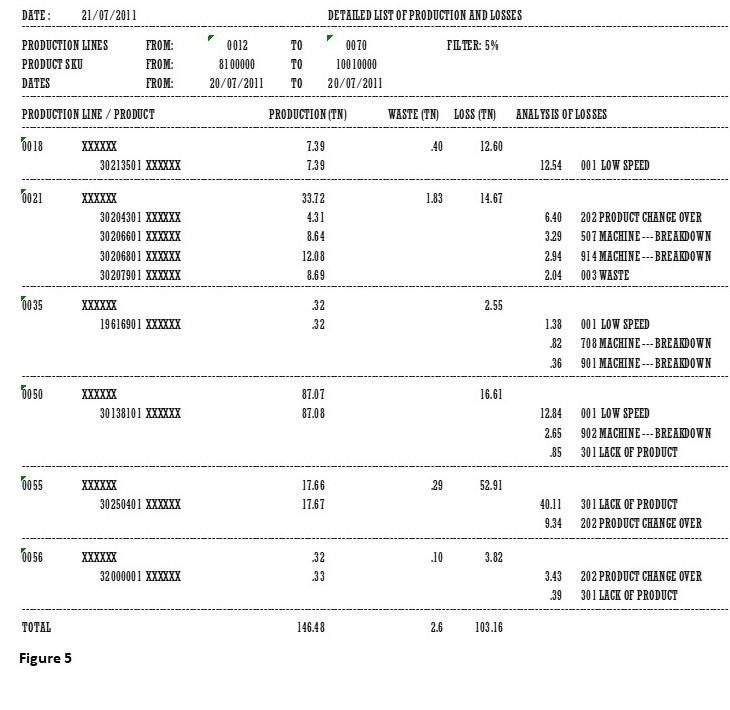 automatically a Pareto analysis that leads the initiation of specific improvement projects.
The Maintenance Manager has an accurate picture of the availability of all the production lines and can better plan the maintenance jobs. The loading time and the downtime data is an important data entry for the Computerized Maintenance Management System (CMMS) to plan the maintenance orders. Important to mention is that, from the downtime and performance loss data, the PLMS calculates the Mean Time to Repair (MTTR) and the Mean Time Between Failures (MTBF). These are important KPIs for the assessment and further improvement of the Maintenance function; for example to develop tools to facilitate and expedite the difficult and demanding maintenance jobs.
The PLMS maintains the historical data and provides an excellent database for all sorts of data mining. Among the numerous data analytics that can be wisely implemented to hammer out valuable insights, the loss data contribute to the determination or revision of the OEE targets per production line or even to the split of the OEE target down to the targets per each individual loss reason. Besides, the PLMS provides the information to judge past decisions and validate past improvement projects. This is why the OEE is an important Key Process Indicator (KPI) .
How to make the most out of monitoring the operational efficiency?
The value of the PLMS tool increases exponentially with the number of people that are using it. The PLMS is adaptable to each factory peculiarities and soon becomes a decision support tool for everybody in the factory and not only. Here is how.
The production line team can assess their progress in their improvement projects or propose new ones.
The Production Manager does a follow up of each production line OEE to evaluate the effectiveness of the execution of the improvement projects Masterplan. He can also monitor the effectiveness of the production plan and monitor the productivity of the production department (see fig.3).
The Maintenance Manager monitors the effectiveness of the Maintenance plan, as well as his activities to improve the effectiveness of the maintenance jobs, for example to make a machine a zero breakdown one.
It has been proven beneficial to expand the skills of the operators in the maintenance area to create technician-operators. The technician-operator will be able, beyond the elementary maintenance work like cleaning, lubrication and checking, to also carry out maintenance jobs. This will offer the factory the great flexibility to increase the maintenance activity in the low capacity utilization periods. The technician-operators can propose clever improvement activities on the production lines. Besides, they improve the quality of the maintenance jobs, because they know exactly every pain point on the production lines and how to better fix it, to make their life easier during the production time.
The PLMS is an excellent tool to facilitate the coordination of the production and maintenance with the warehouse, the dispatch and the sales functions, because they share the same accurate and reliable on-line / real-time data. This can best be realized by the integration of the PLMS with the ERP (Enterprise Resource System) of the company. Here are some quick wins:
- the MRP can easily be kept up to date,
- the production orders can be immediately sent from the ERP planning module to each relevant production line,
- the maintenance orders can be similarly distributed to the production lines and thus avoid any conflict with the production orders, something very common on the shop floor production planning / scheduling,
- the produced lots are continuously updating the production planning / scheduling module, the Warehouse Management System (WMS) and the demand planning and dispatch operations.
In the environment of digital transformation, the PLMS is an essential element of the Management Execution System (MES) of the factory, which belongs to the so-called automation stack. The latter integrates from bottom up the PLCs, the HMI (Human Machine Interface), the SCADA, the DCS (Distributed Control System), the MES, the ERP and the Cloud. In this set up the PLMS can continuously feed the data pool (also known as the namespace) and, in this way, share invaluable data with everybody interested, in the factory and the whole company.
How does operational efficiency contribute to the business strategy?
The OEE monitoring through the PLMS greatly helps to improve the contribution of every level in the factory and aligns the work of everybody with the company strategy. It provides the company dashboard with important KPIs, that are a good benchmark index that highlights the comparison of the factory to the competition and indicates the distance to the world class manufacturing (3); incidentally, the generally accepted world class goal of OEE is 85%, made up of 90% availability, 95% performance and 99.9% quality.
The PLMS supports the co-operation among functions and proves to be an invaluable tool of the cross functional teams. It further promotes an integrated approach to continuous improvement. Here are two good examples in product development and customer service.
The PLMS supports the product development project team with OEE and rejects data particularly at the first production trials. It facilitates the so called “vertical start-up”, also known “right-the-firtst-time” in the factory and reduces the time to Market.
The PLMS helps in improving the flexibility and supports the production planning and the demand planning functions resulting in maximizing the customer service. This can be achieved by reducing the change over time, which enables the reduction of the production batches or the increase of the number of production runs without burdening the OEE. Thus, the stocks are minimized, stock outs are prevented and the warehouse is better off in fulfilling the dispatch orders, which results in boosting the customer service (2).
The continuous follow up of the OEE renders the PLMS an invaluable tool for putting the strategy into action, because it prioritizes the improvement projects to expedite the reduction and even the elimination of the big losses. More importantly it checks the stabilization of past improvements by following up on loss monitoring.
The PLMS, through its contribution to the company namespace, can feed any machine learning or artificial intelligence algorithm with data to get valuable business and operational insights.
Finally, through the facilitation of the improvement projects, the losses are reduced, the productivity is improving, and the factory costs go down. The cost reduction and the customer service improvement convert the factory from a simple cost center to a profit center (4) favorably contributing directly to the base line of the business.
A final word of caution is appropriate here. The monitoring of OEE on its own cannot make everything happen. It is an essential KPI that supports the continuous improvement and the decision making in a factory, particularly in the integrated cross-functional activities. It is there, where OEE and PLMS can really be a corner stone of the factory, in a role seamlessly interwoven wth the company development.
25.2.2020
Alkis Charalambopoulos,
www.leansolutions.gr
Keywords: Operational Efficiency, Overall Equipment Efficiency, Valued Operating Time, Name Plate Speed, improvement projects, technician-operator, digital transformation, benchmarking, factory.